Your contract overview at a glance
The dashboard shows you the most important metrics and trends about your contracts – all on one page.
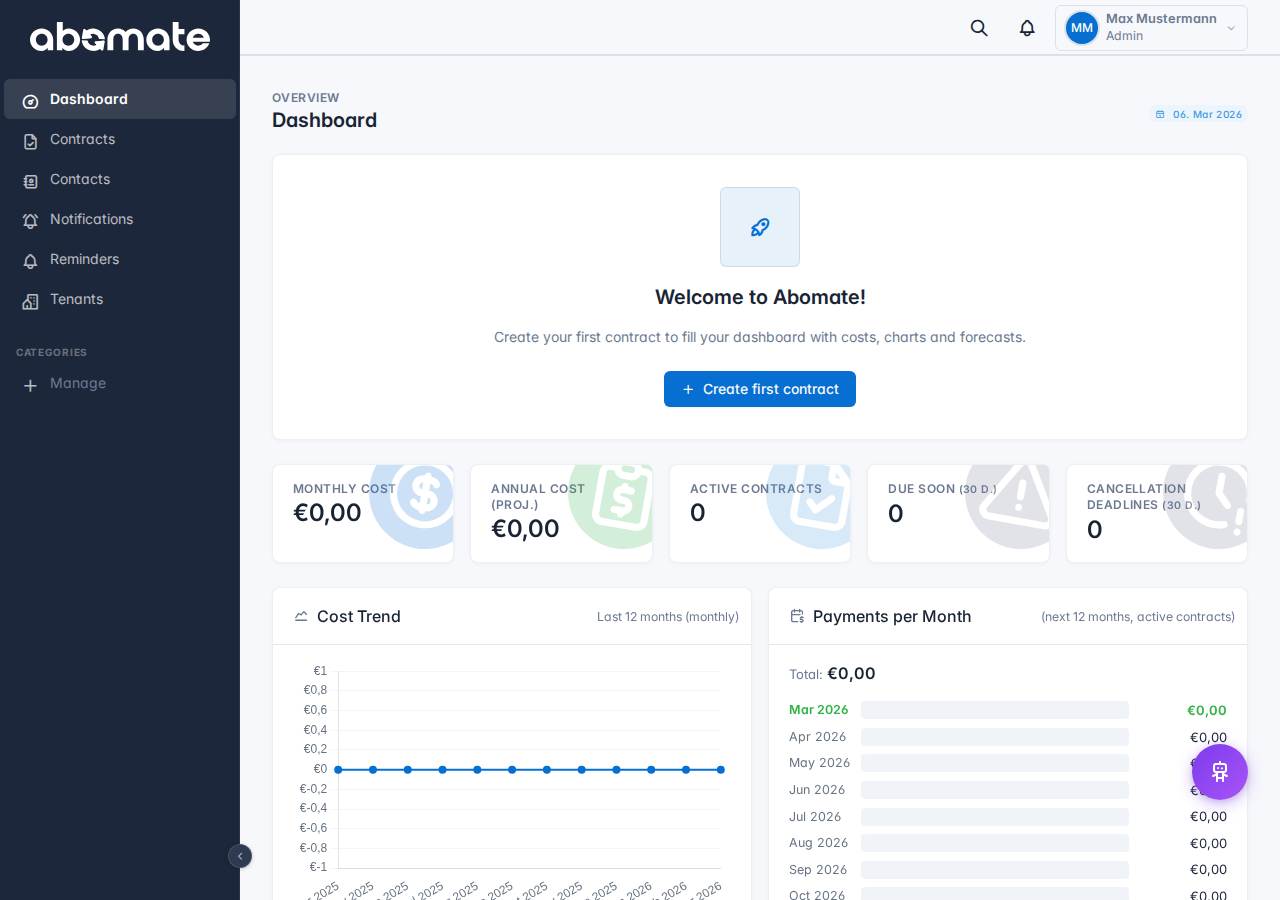
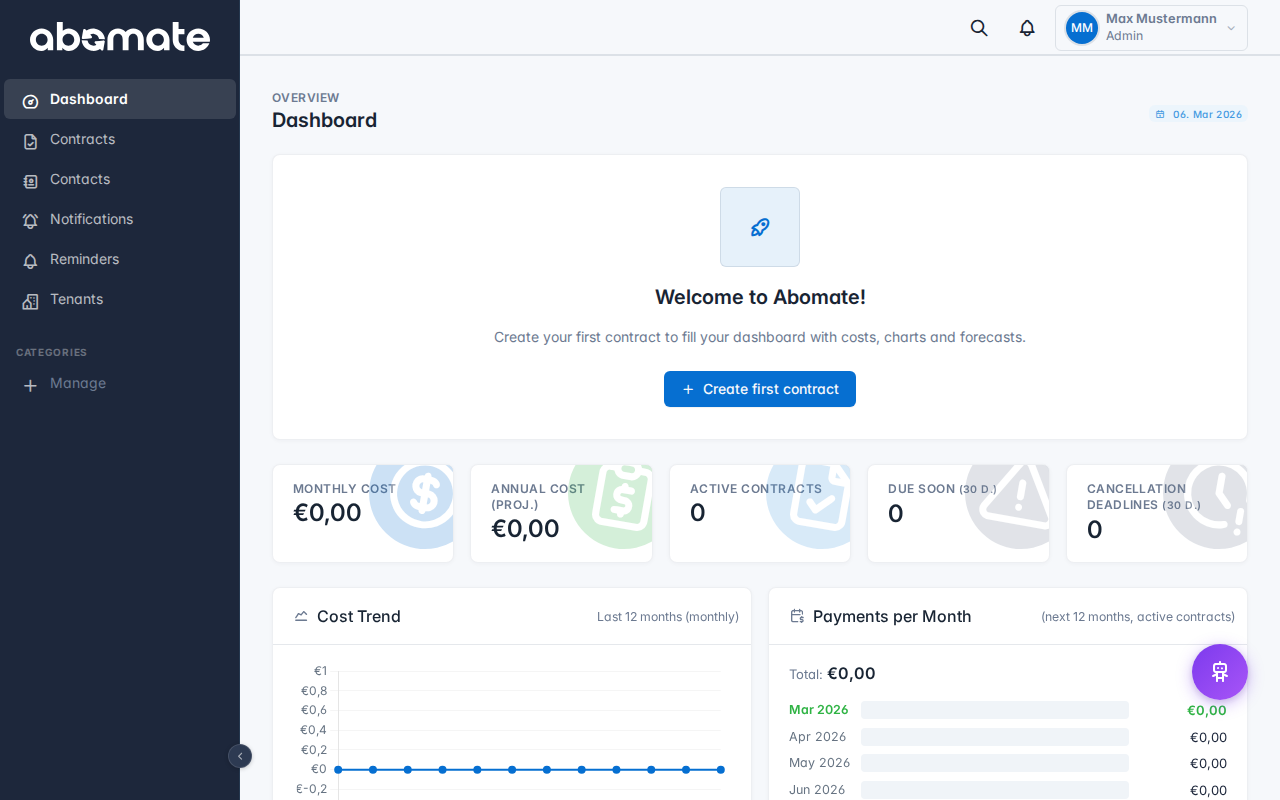
KPI tiles
At the top you see four tiles with key figures:
| Tile | Description |
|---|---|
| Active contracts | Number of contracts with "Active" status |
| Monthly costs | Sum of all monthly costs, converted to your default currency |
| Expiring soon | Contracts expiring within the next 30 days |
| Categories | Number of categories in use |
Charts

Below the tiles you find three charts:
- Cost distribution (Pie Chart) – Shows how your costs are distributed across categories
- Cost trend (Bar Chart) – Monthly costs over the last 12 months
- Liquidity forecast – Planned expenses for the coming months based on contract terms
Purchase/Sale view
If you have entered a sale price for contracts, the dashboard also shows the margin – the difference between your purchase costs and sale prices.
Tip: All amounts are automatically converted to your default currency. Exchange rates are updated daily from the ECB. You can change the default currency under Settings → General.